Like the majority of iPhone developers we have been very interested in the sales figures being released by people such as Joel Comm (iFart) and Firemint (Flight Control). Thanks to these very kind releases of information developers of all sizes can see the potential of a massive selling game. Having studied these figures we have tried to gain some perspective and understand whether $.99 apps are a viable long term business. Since the data that this research was based on was put into the public domain then it only seemed fair that we share the results with the iPhone developer community.
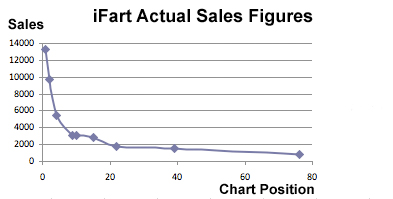
We started with the great data that the developer of iFart made public in December 2008. This linked chart position to sales figures, producing the chart below.

Extended Sales Figures
This shows all the signs of a hit driven ‘Long Tail’ business as discussed in Chris Anderson’s book ‘The Long Tail’.
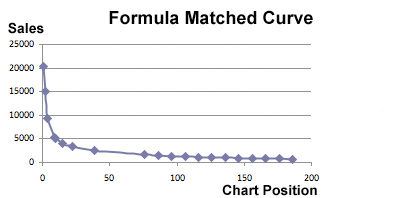
To be useful for our research we needed to extend this curve further into the lower chart positions. We therefore came up with a formula that matched the iFart data and allowed us plug in any chart position and get out a number of sales.
OK, it’s time for a massive disclaimer. Whilst these figures are based on actual data we are in no way claiming that if you achieve a particular chart position will you necessarily see the same sales figures.
iFart seems to have been a phenomenon mainly in the USA and we wanted to look at the best case scenario of a worldwide smash hit. So, when Firemint released their sales figure we could adjust the figures upwards and produce a new graph.

Extended Sales Figures
Now that we had this great formula we could model how chart position affects sales. We created four categories of game sales performance.
- Excellent represents a game that reaches number one for 6 weeks and sells in the region of 750,000 over it’s lifetime.
- Good represents a game that reaches a highest position of 15 in the charts and sells in the region of 220,000 over it’s lifetime.
- Average represents a game that reaches a highest position of 70 in the charts and sells in the region of 70,000 over it’s lifetime.
- Poor represents a game that reaches a highest position of 1000 in the charts and sells in the region 3,500 over it’s lifetime.
If we assume that development and marketing spend on a game is $50,000 then the break even point across 10 games would be 1 Good, 4 Average and 5 Poor sellers. Move that one good seller to an Excellent seller and you’ve made a 54% return on investments. However, just change that one Good seller for an Average one and you’ve lost 33% of your investment.
However, it’s interesting to note that if you spend twice as much on development and marketing but charge $2.99 for the game then 1 Good, 4 Average and 5 Poor would generate an ROI of 30% and even 5 Average and 5 Poor would break-even.
Whether you see $.99 games as an opportunity or a huge risk probably depends on your outlook on life. However, it seems to us that the statement that these low price games are unsustainable is probably true.
Hopefully, this post will encourage some healthy debate about the subject if nothing else.
